See your site
and operations
the way an adversary
would.
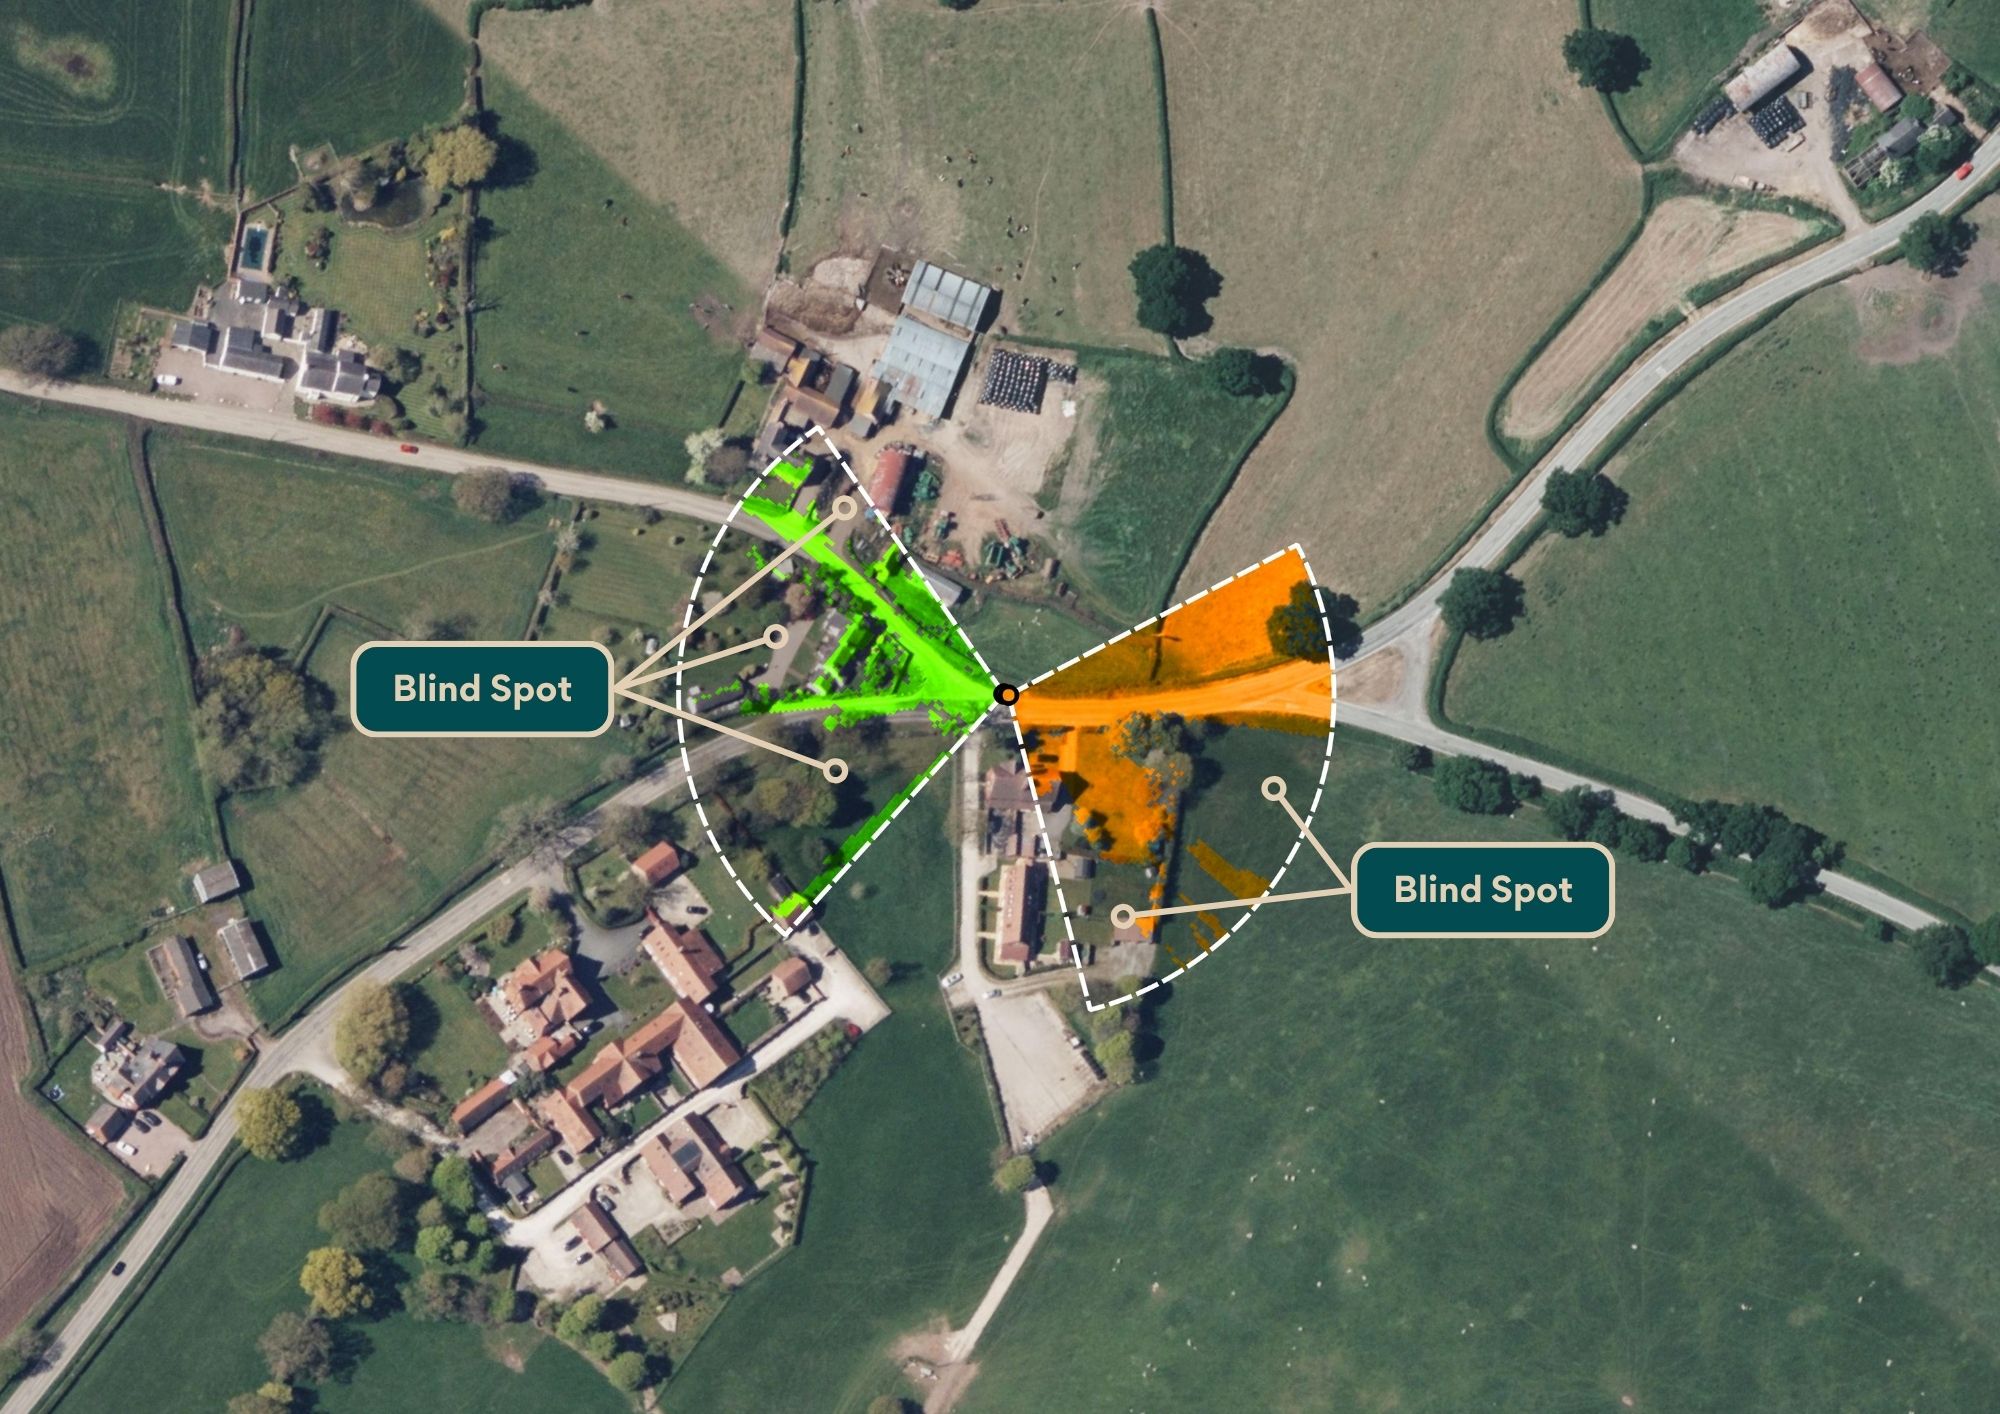
Security Camera Analysis
We calculate your blind spots from elevation data we collect, accurate down to 5cm.
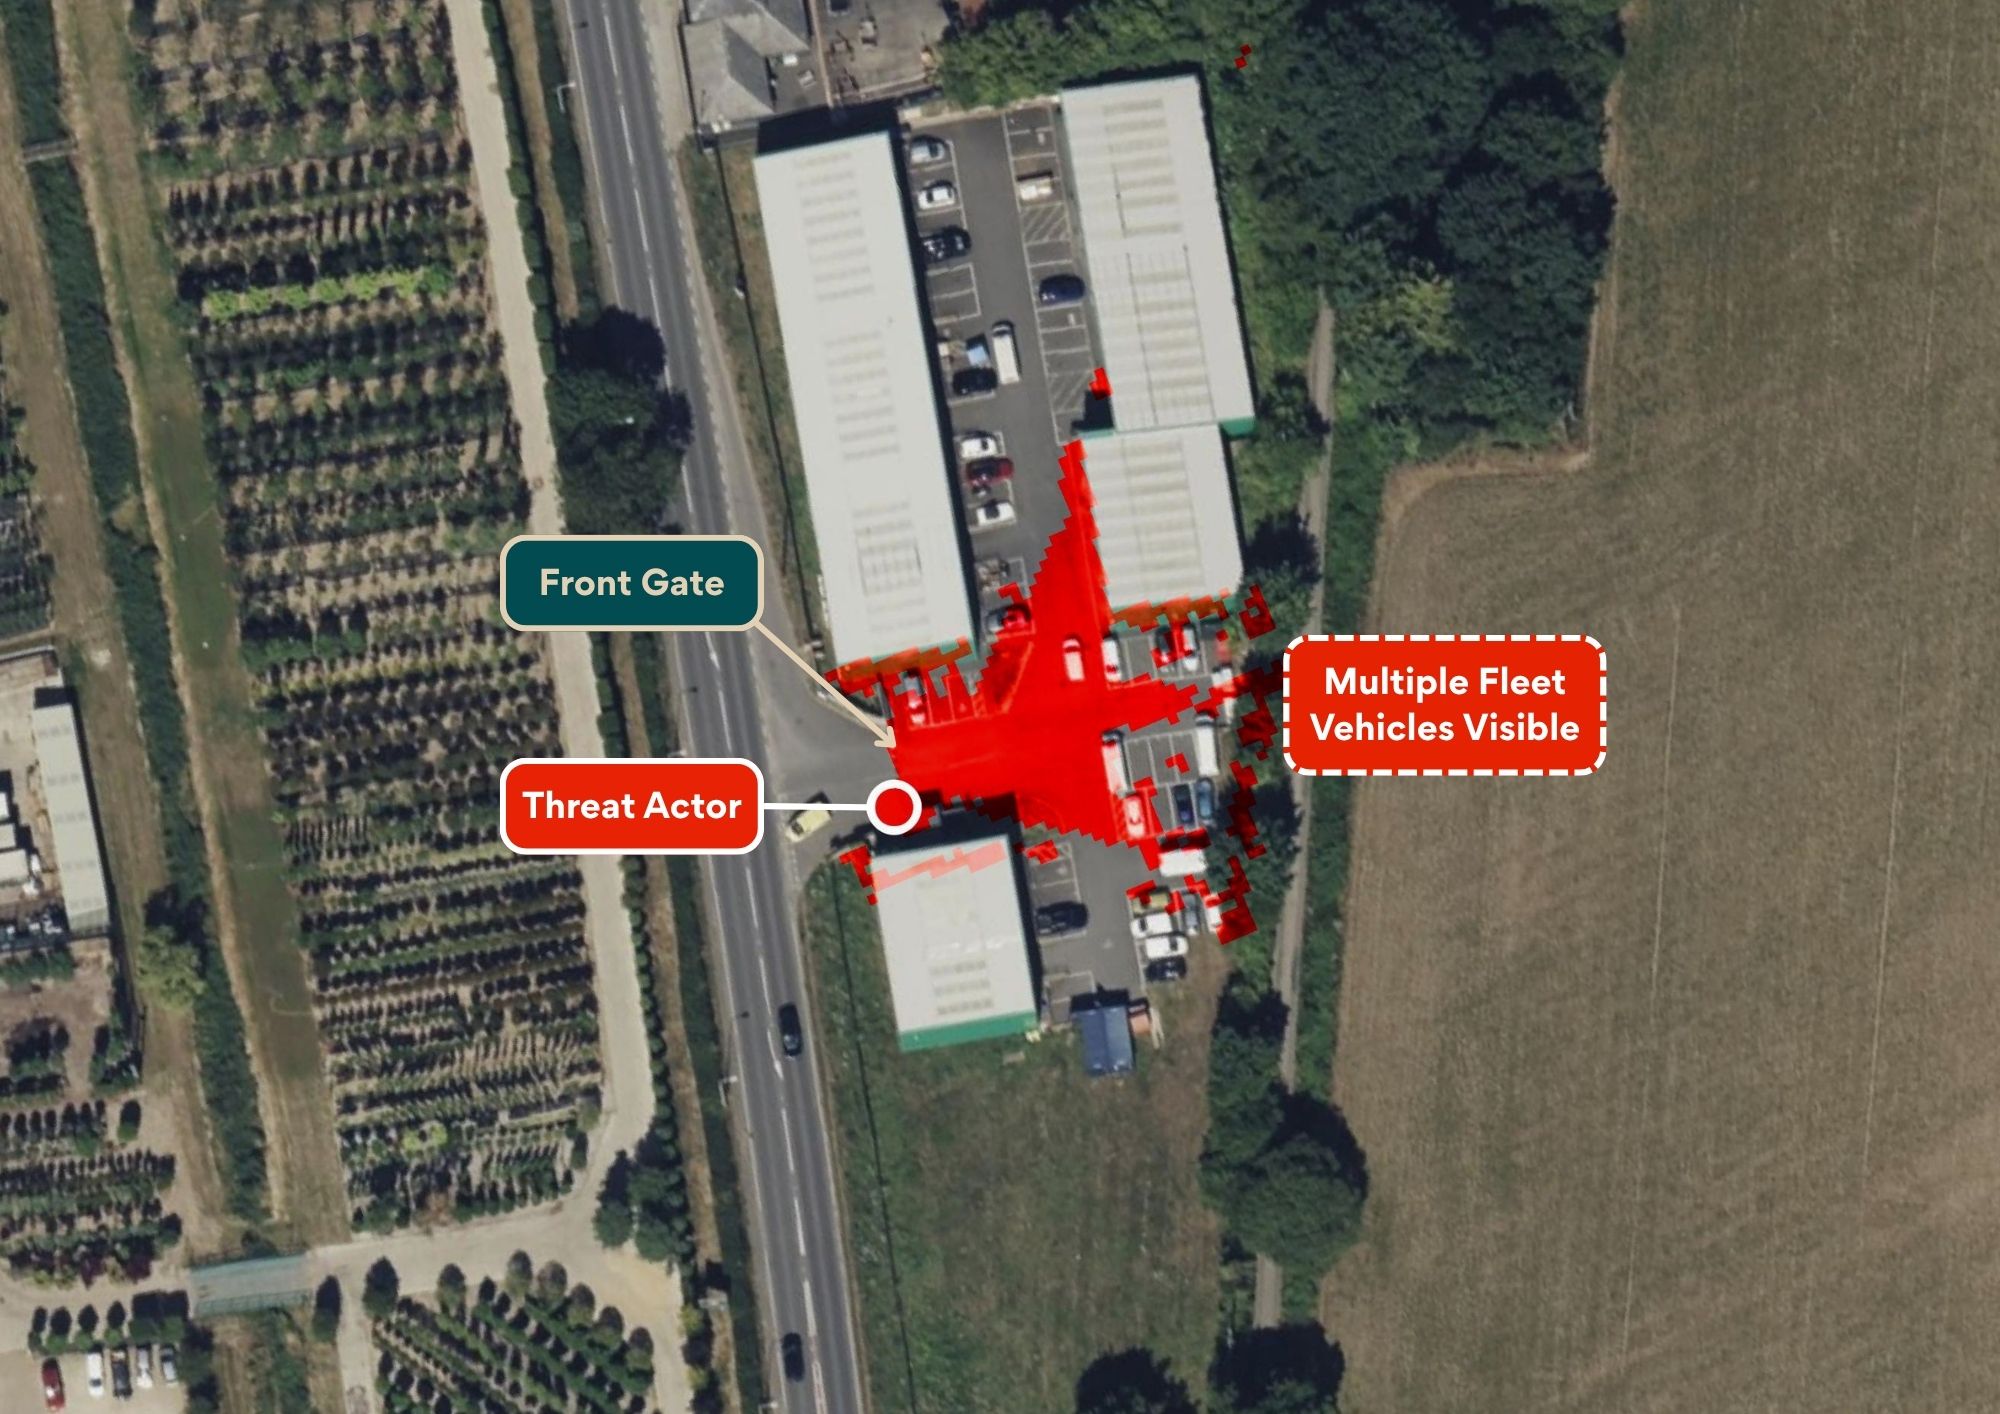
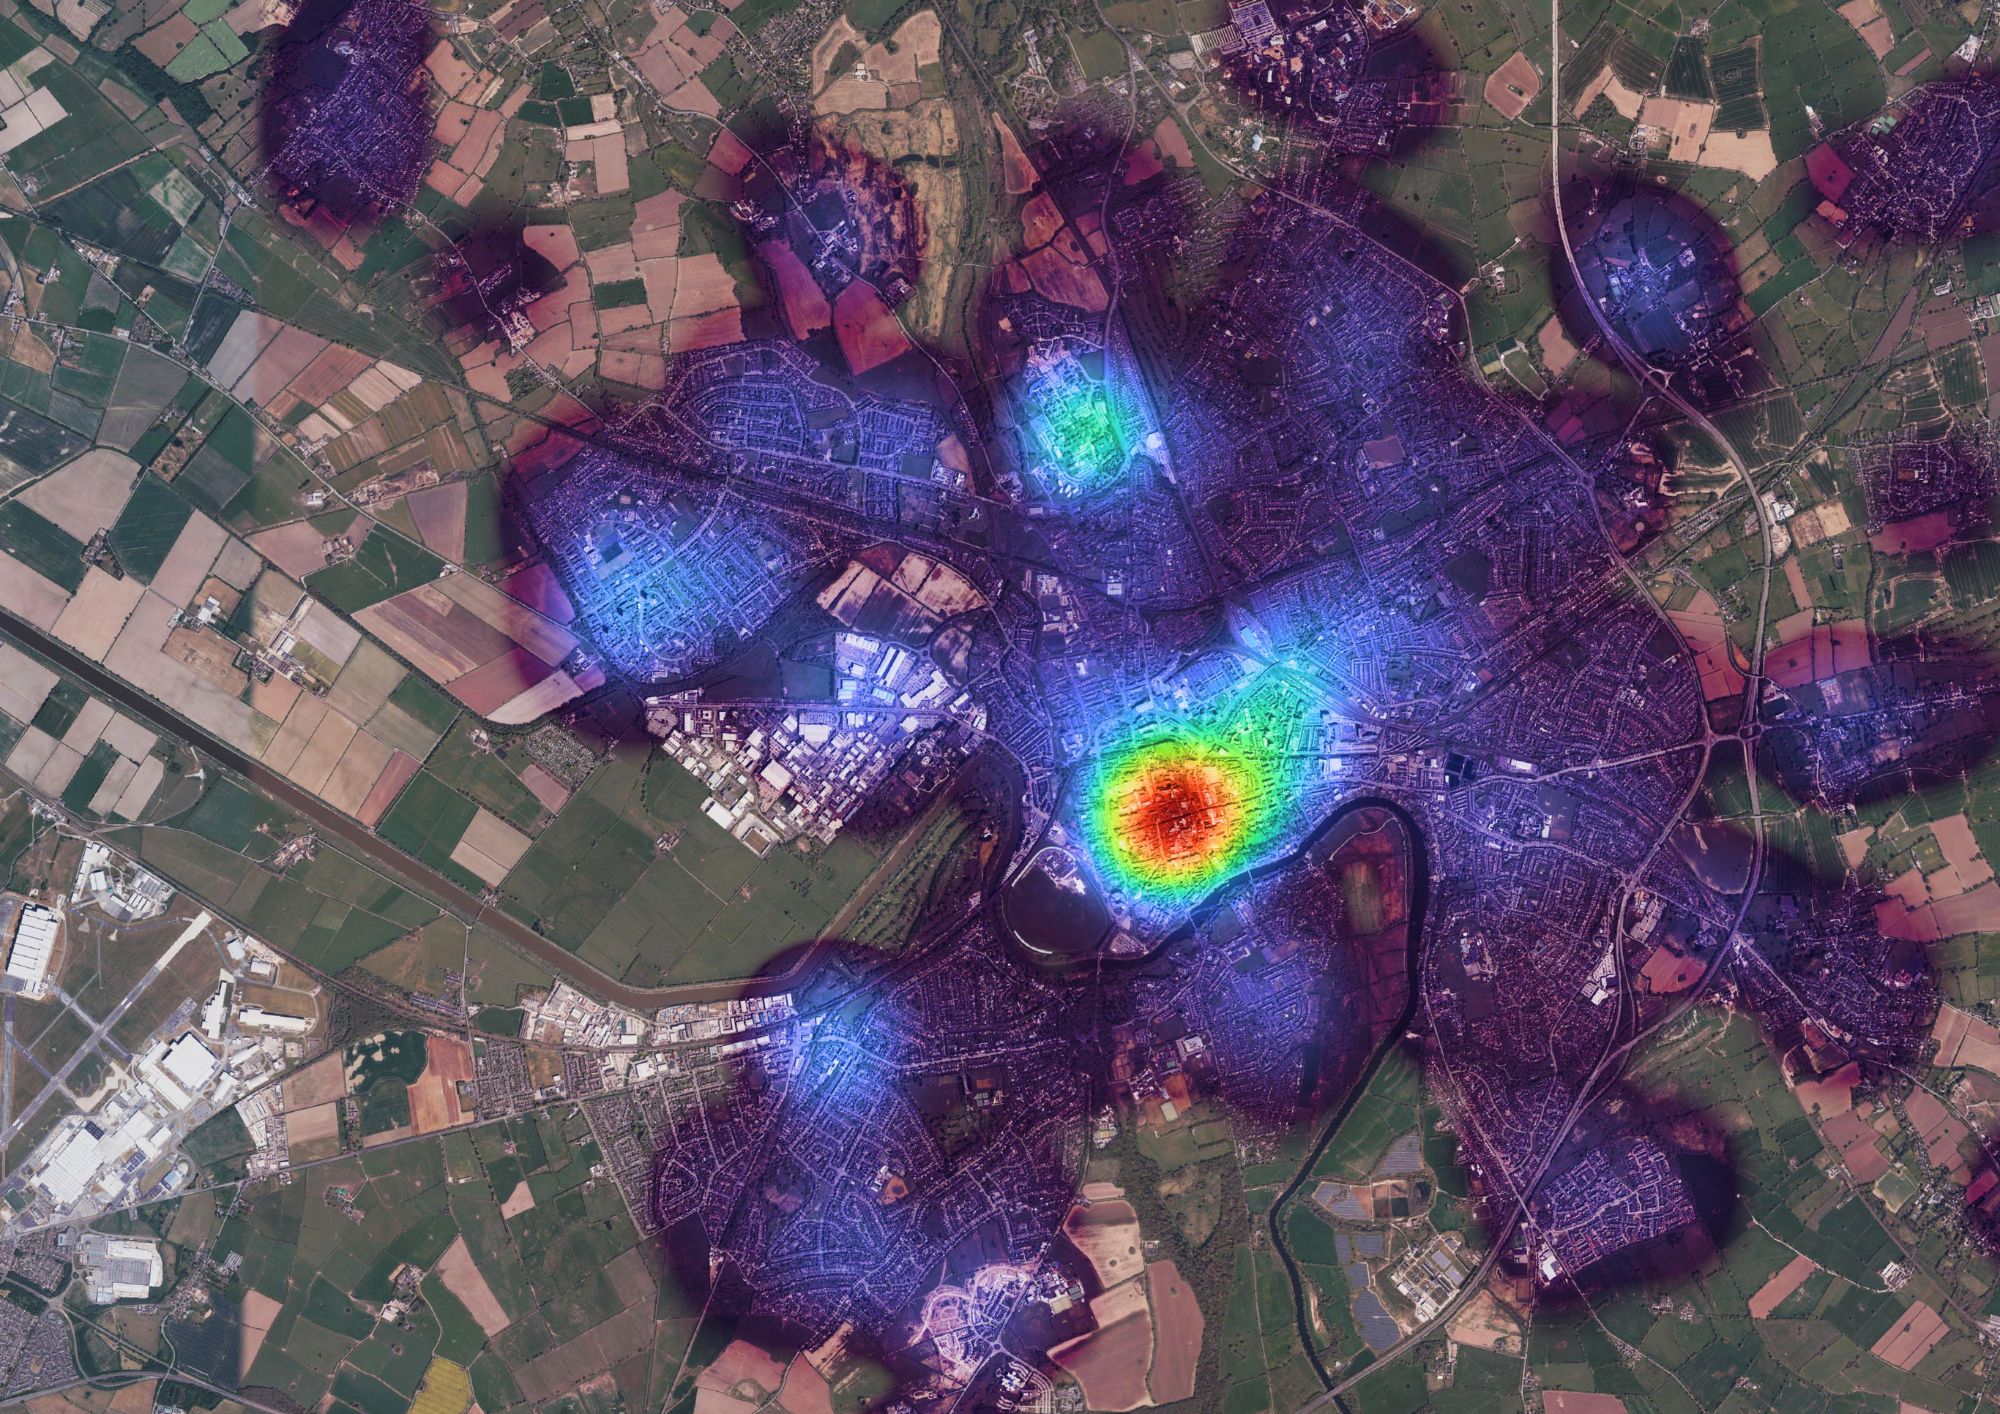
Visibility Analysis
Ever wondered what people can see from the outside of your site? We show you.
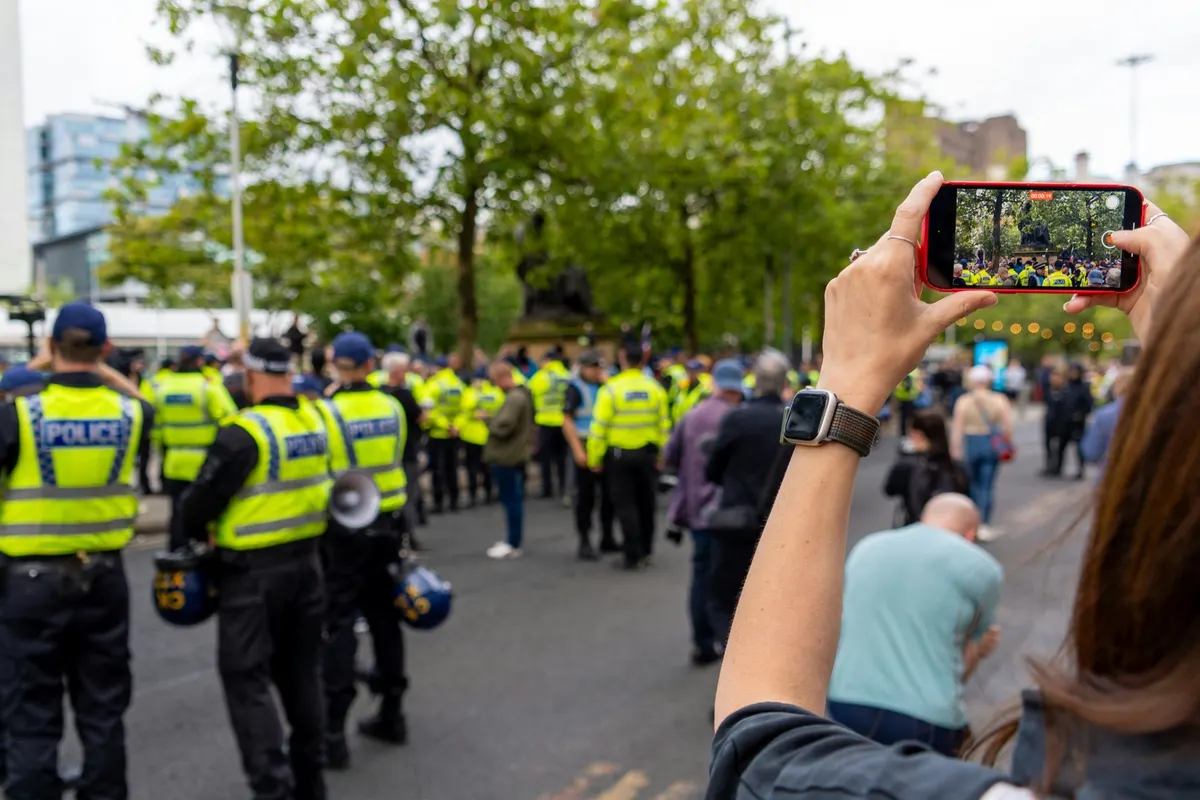
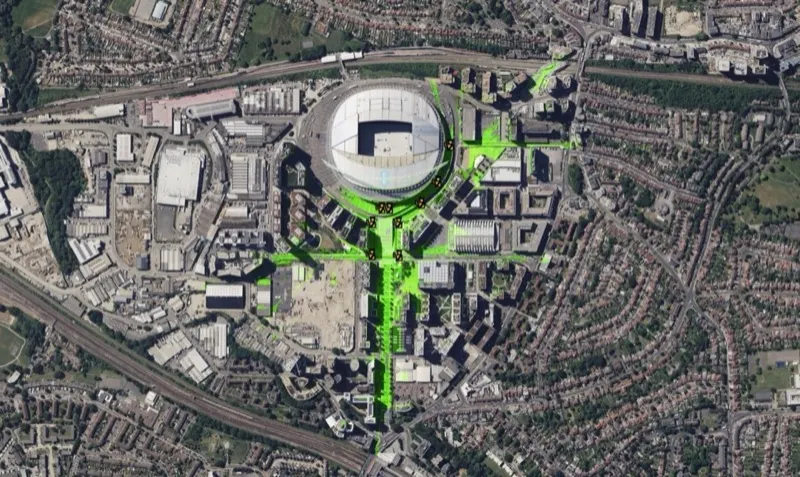
Events
Ingress, egress, choke points, steward visibility, physical and digital mapping for staff and briefings.
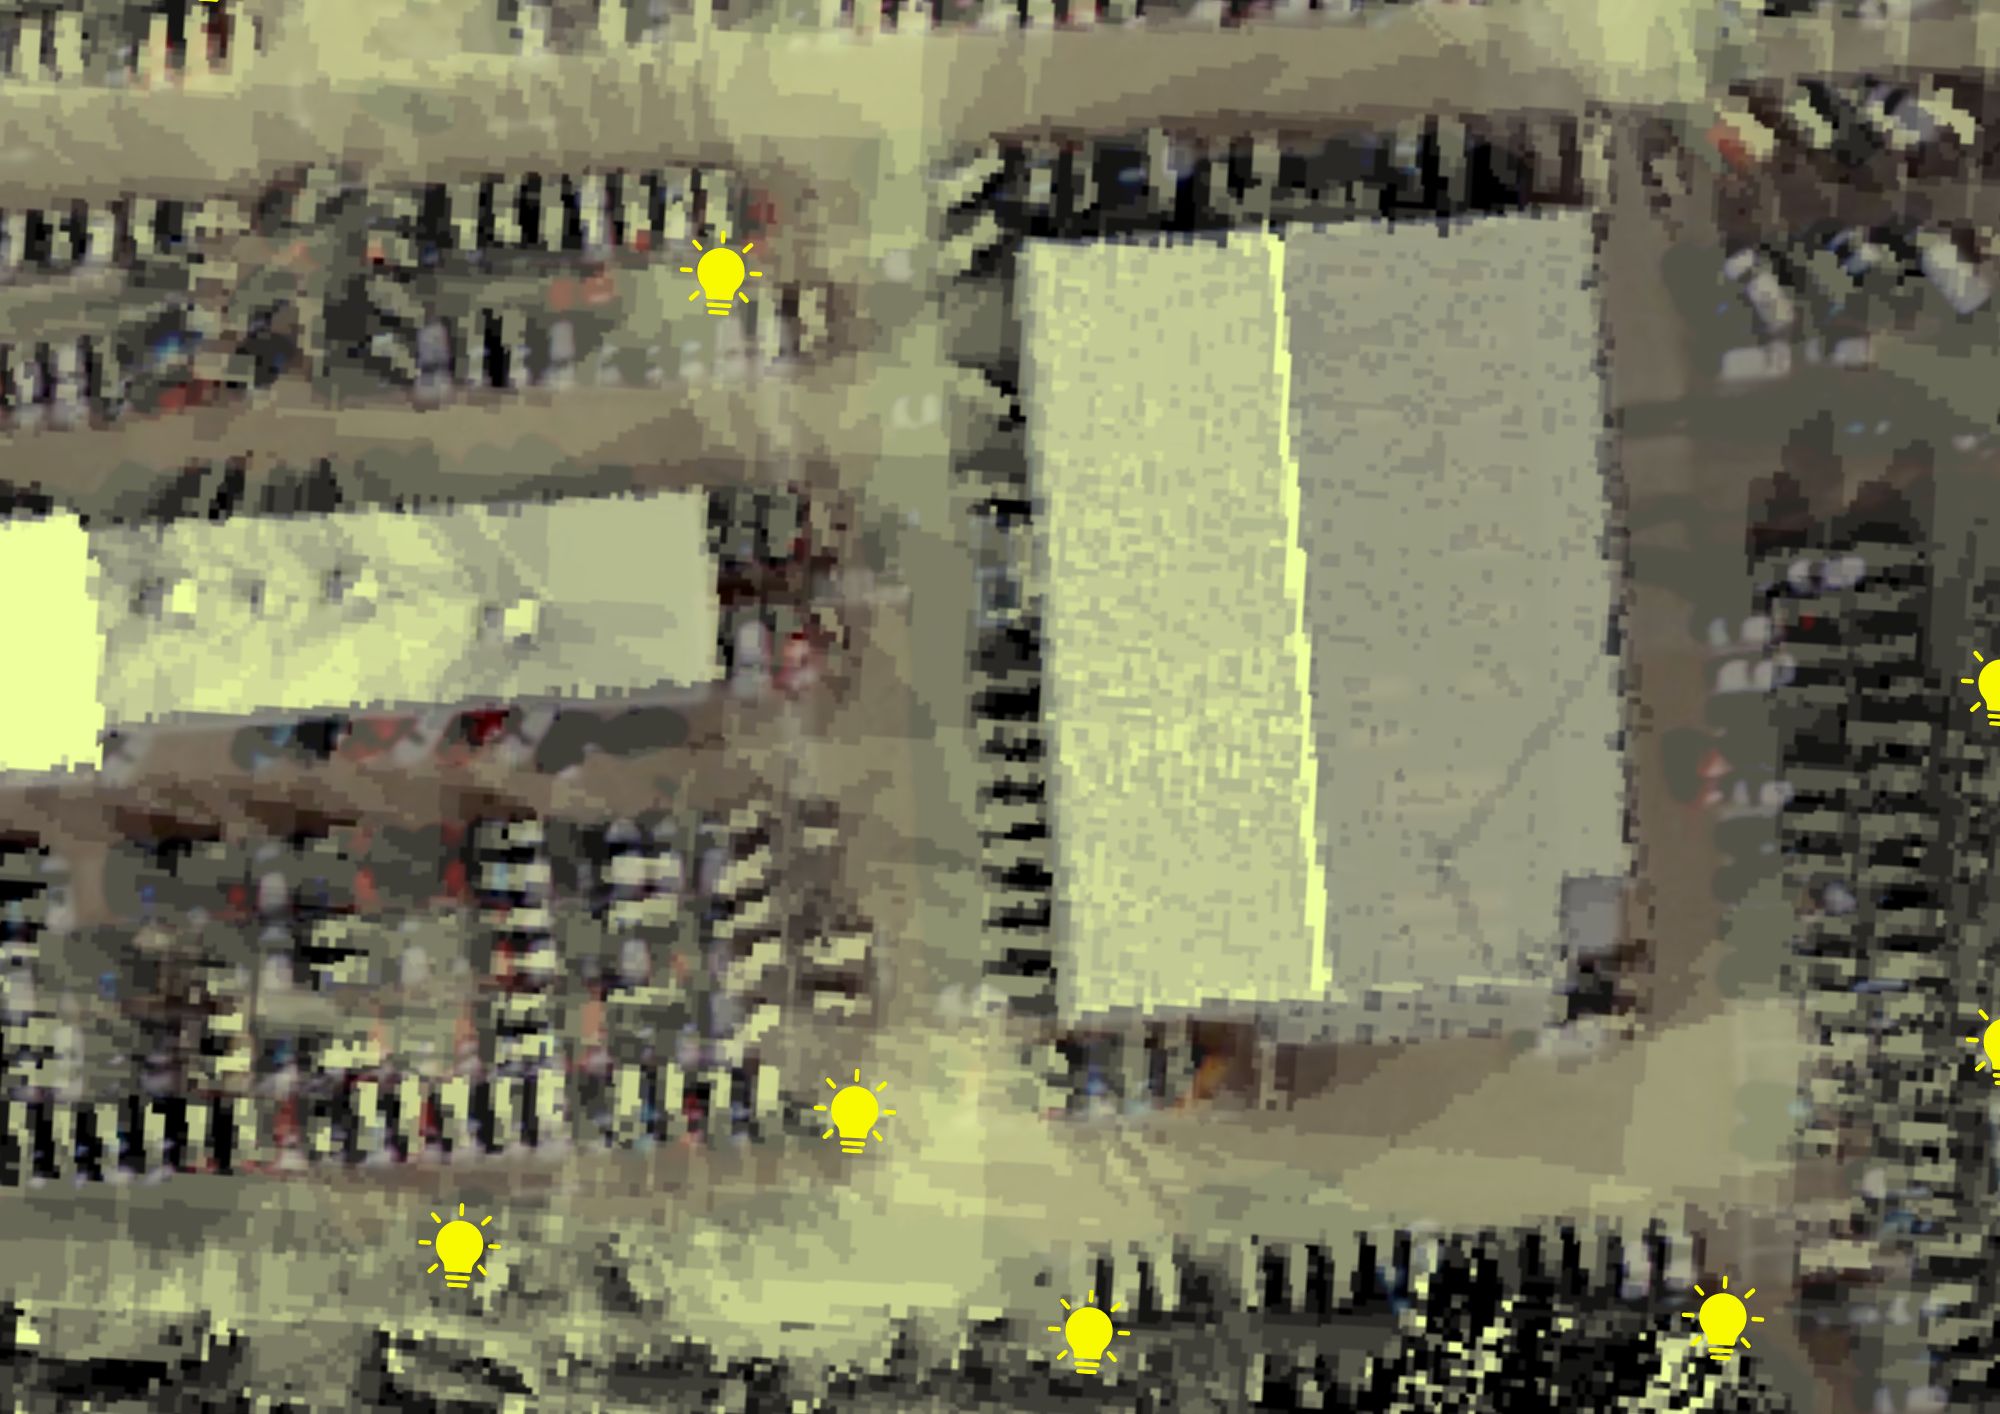
Lighting Analysis
We combine CCTV blind spots with your lighting coverage to determine the most likely areas a threat actor will target.
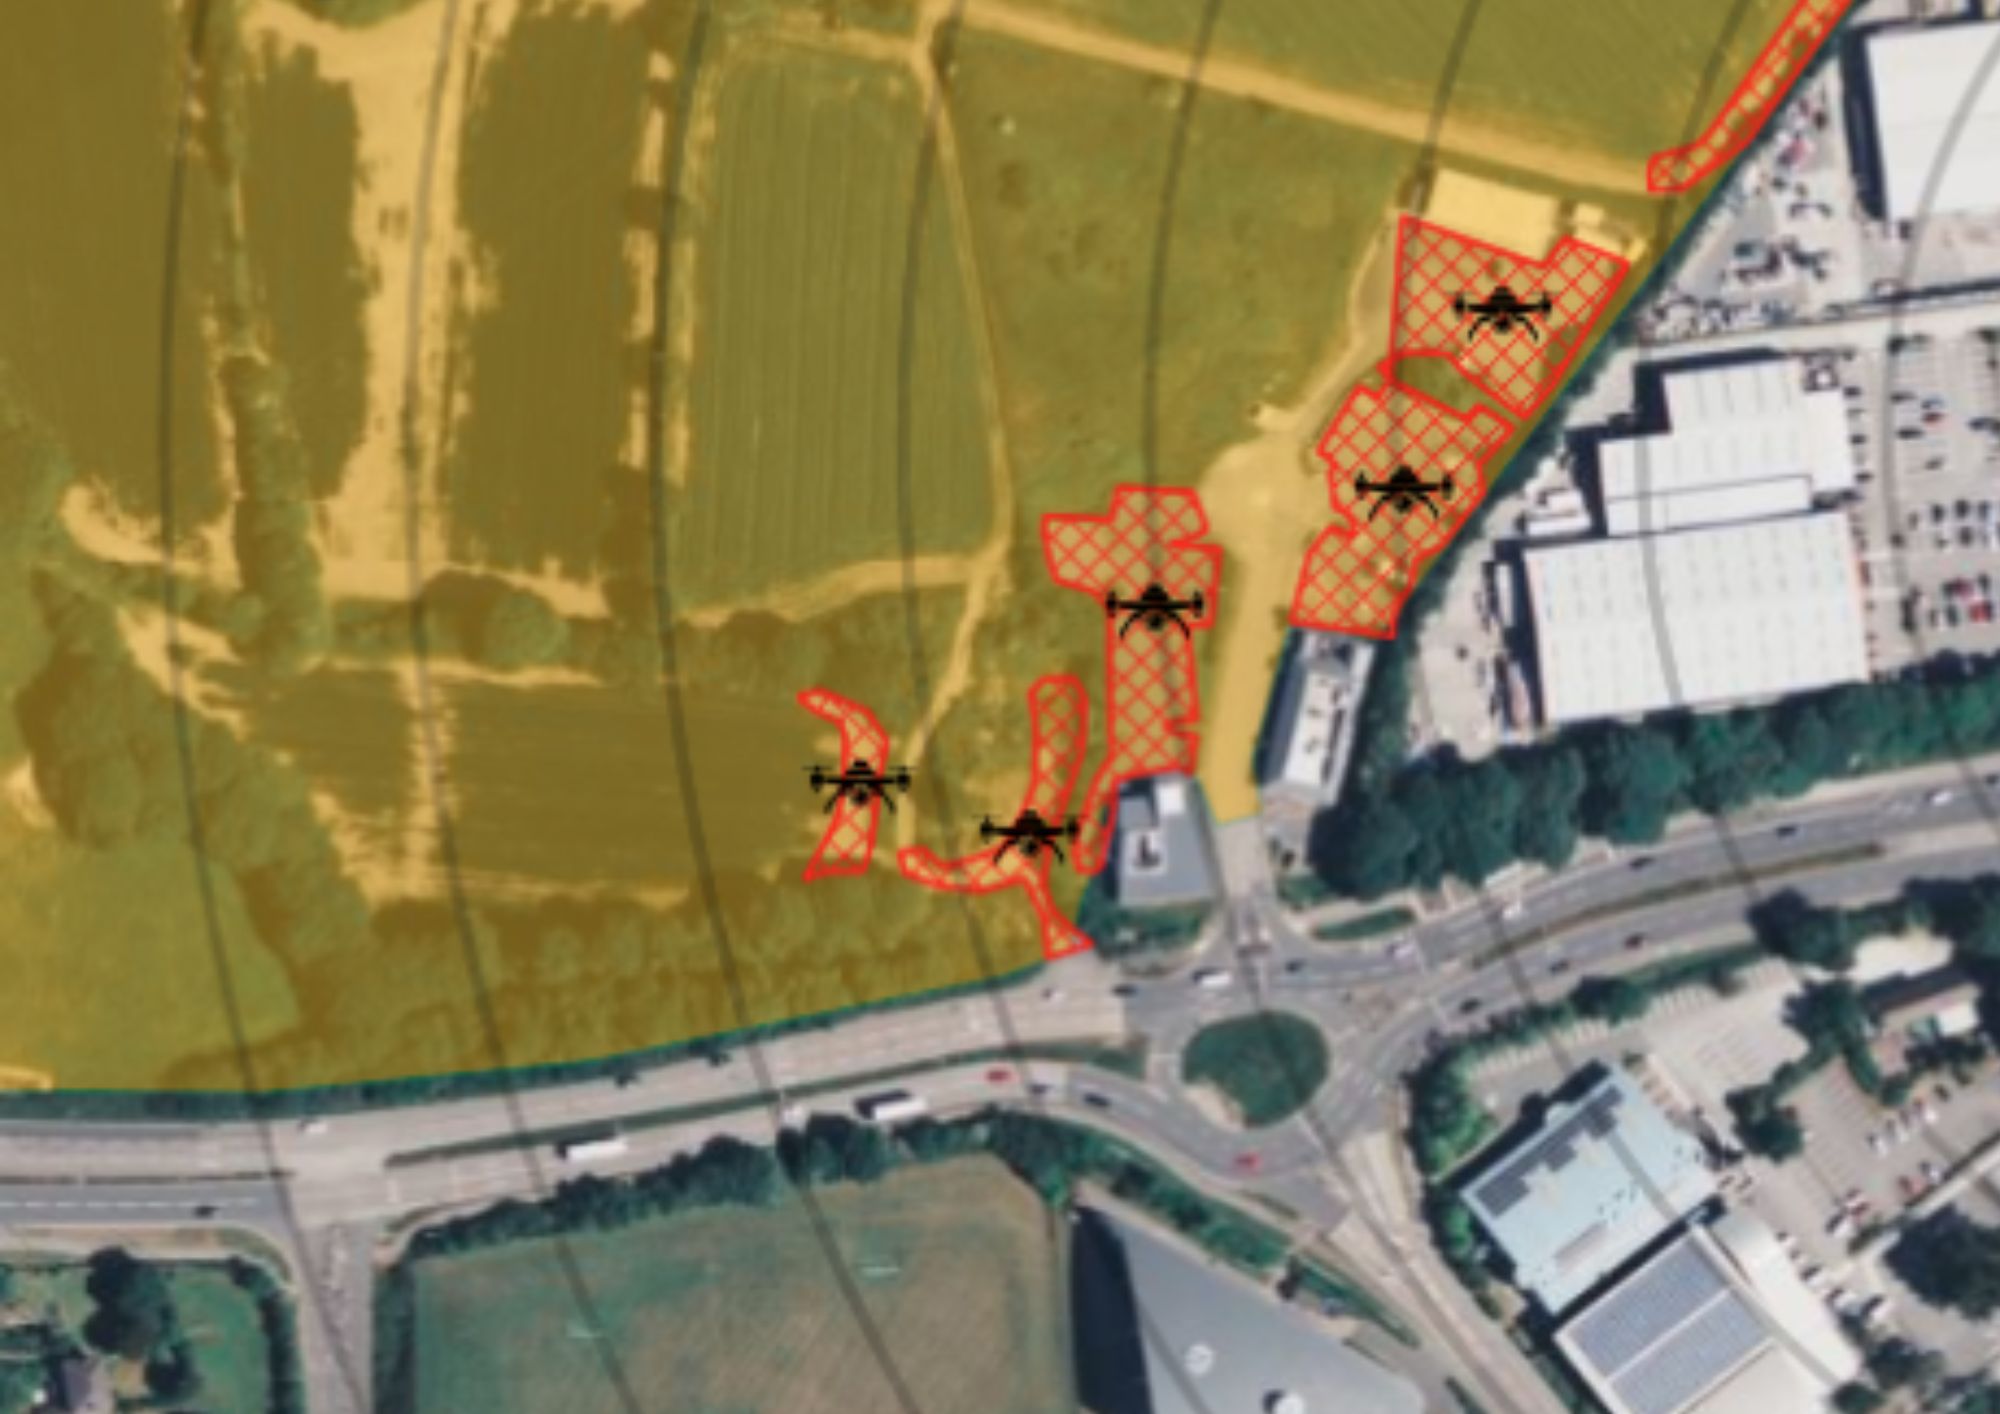
Drone Threat Assessment
The most likely areas a threat actor could launch drone operations within a given radius of your site or event.
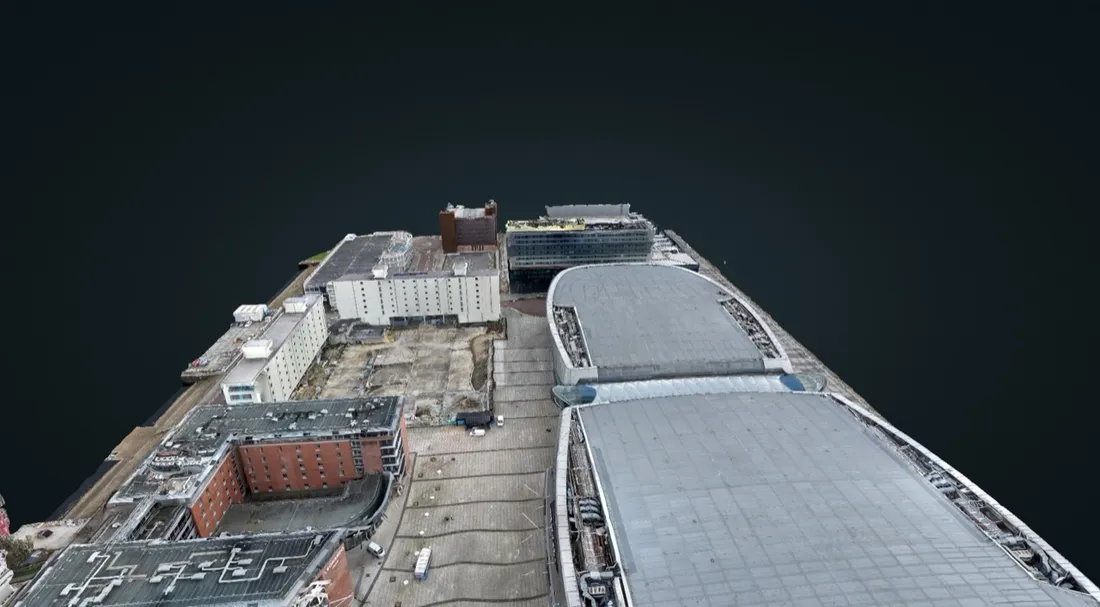
3D Site Modelling
We create an easily viewable and shareable model of your site, built from imagery we capture. Use it to help plan your next event or just brief your staff on a problem area.
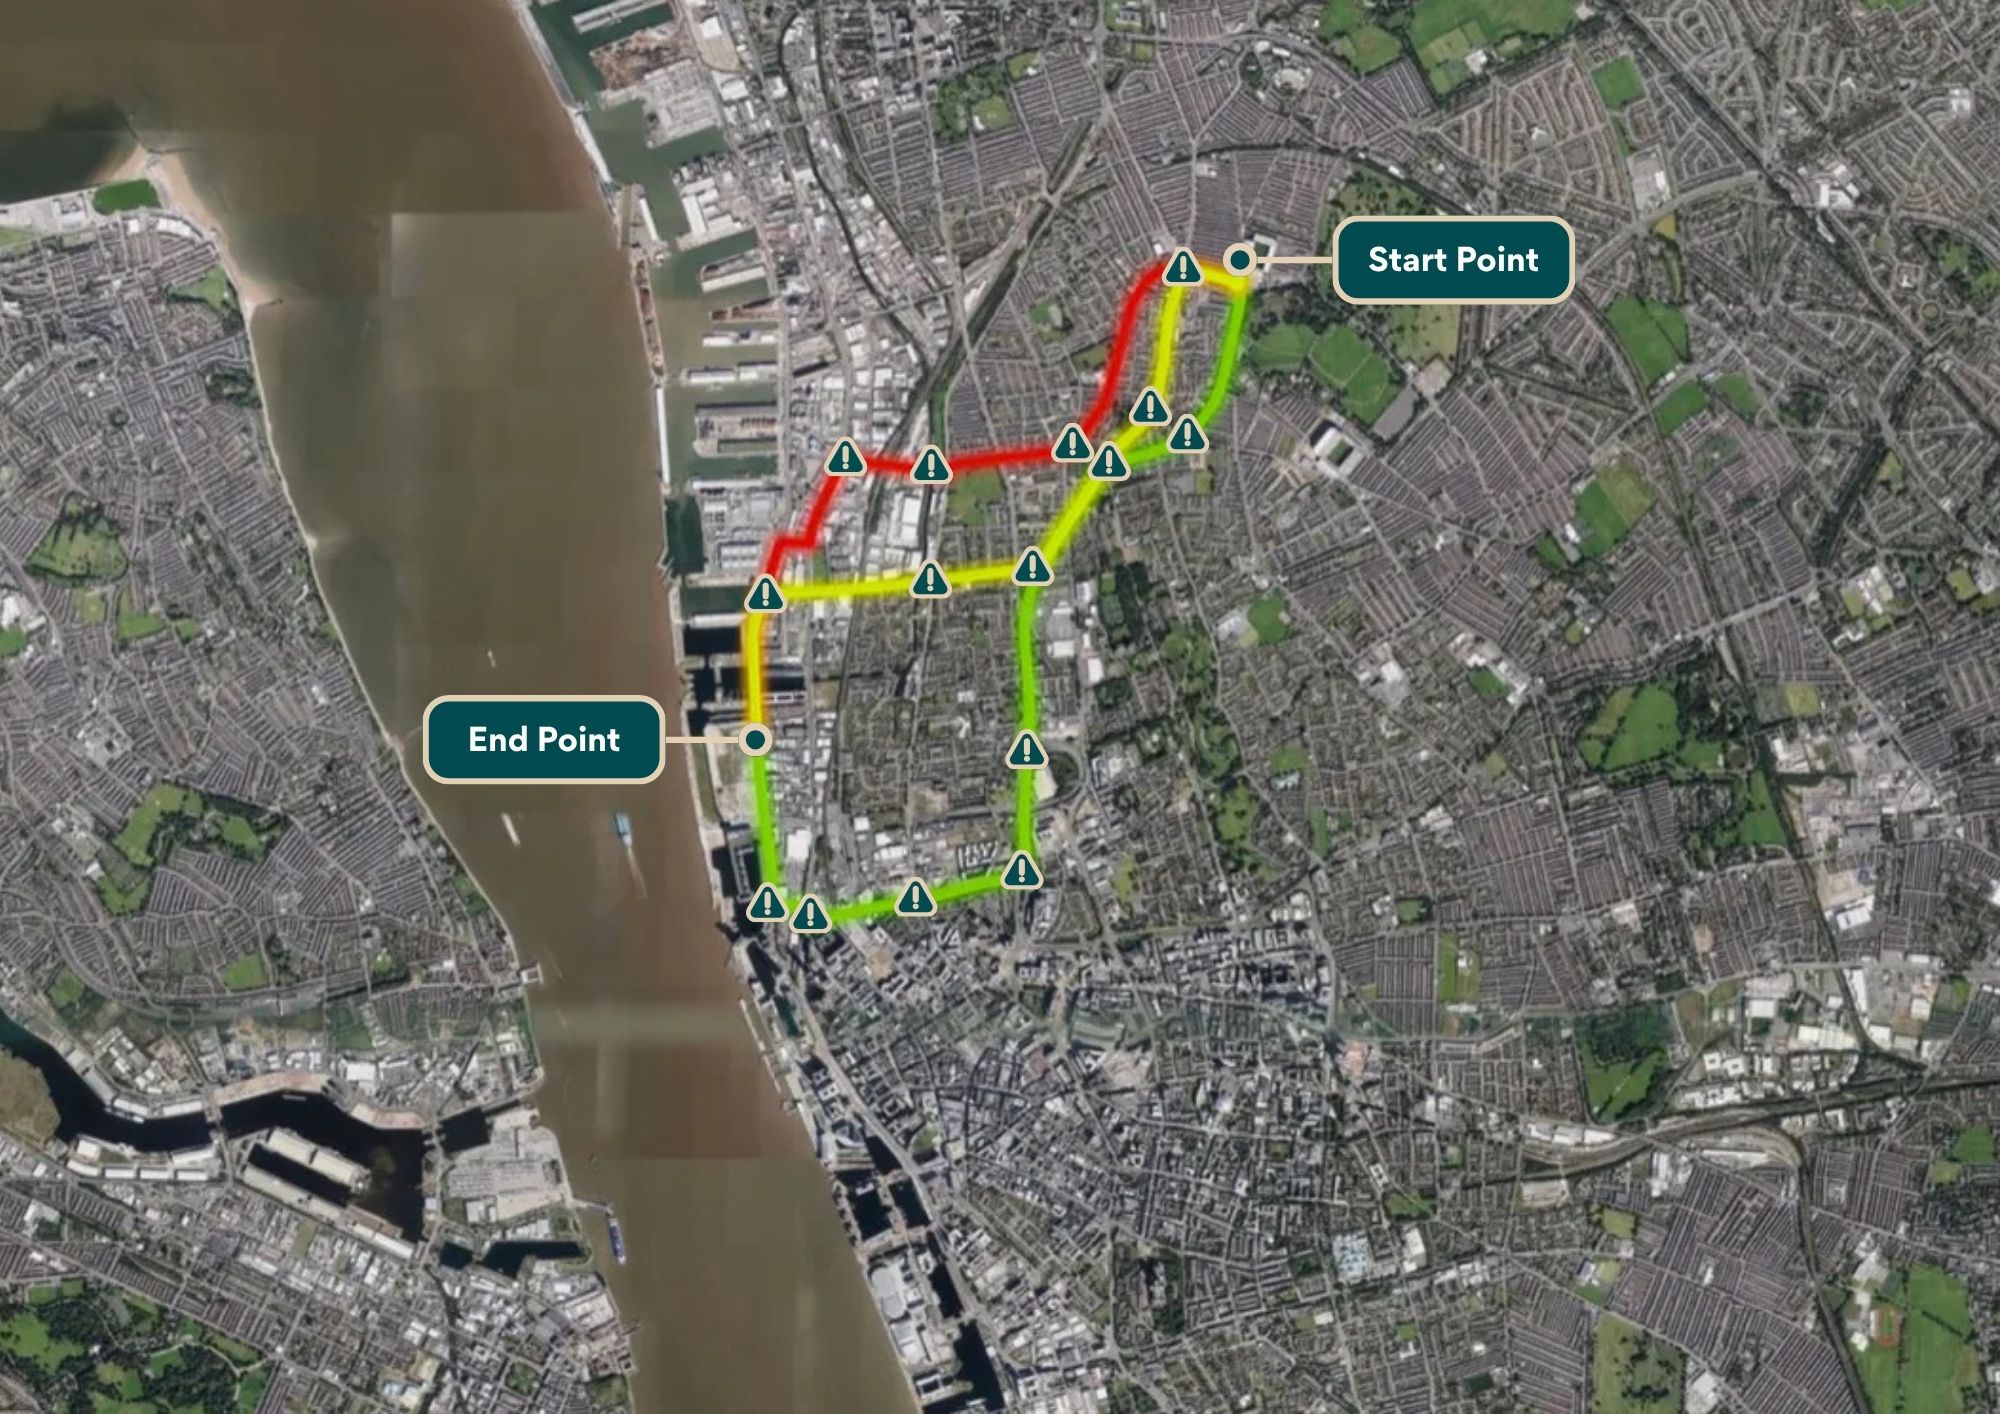
Route Analysis
Primary, secondary and alternate routing for commercially sensitive operations and VIP movements. All assessed for risk along the route, briefed ahead of departure.
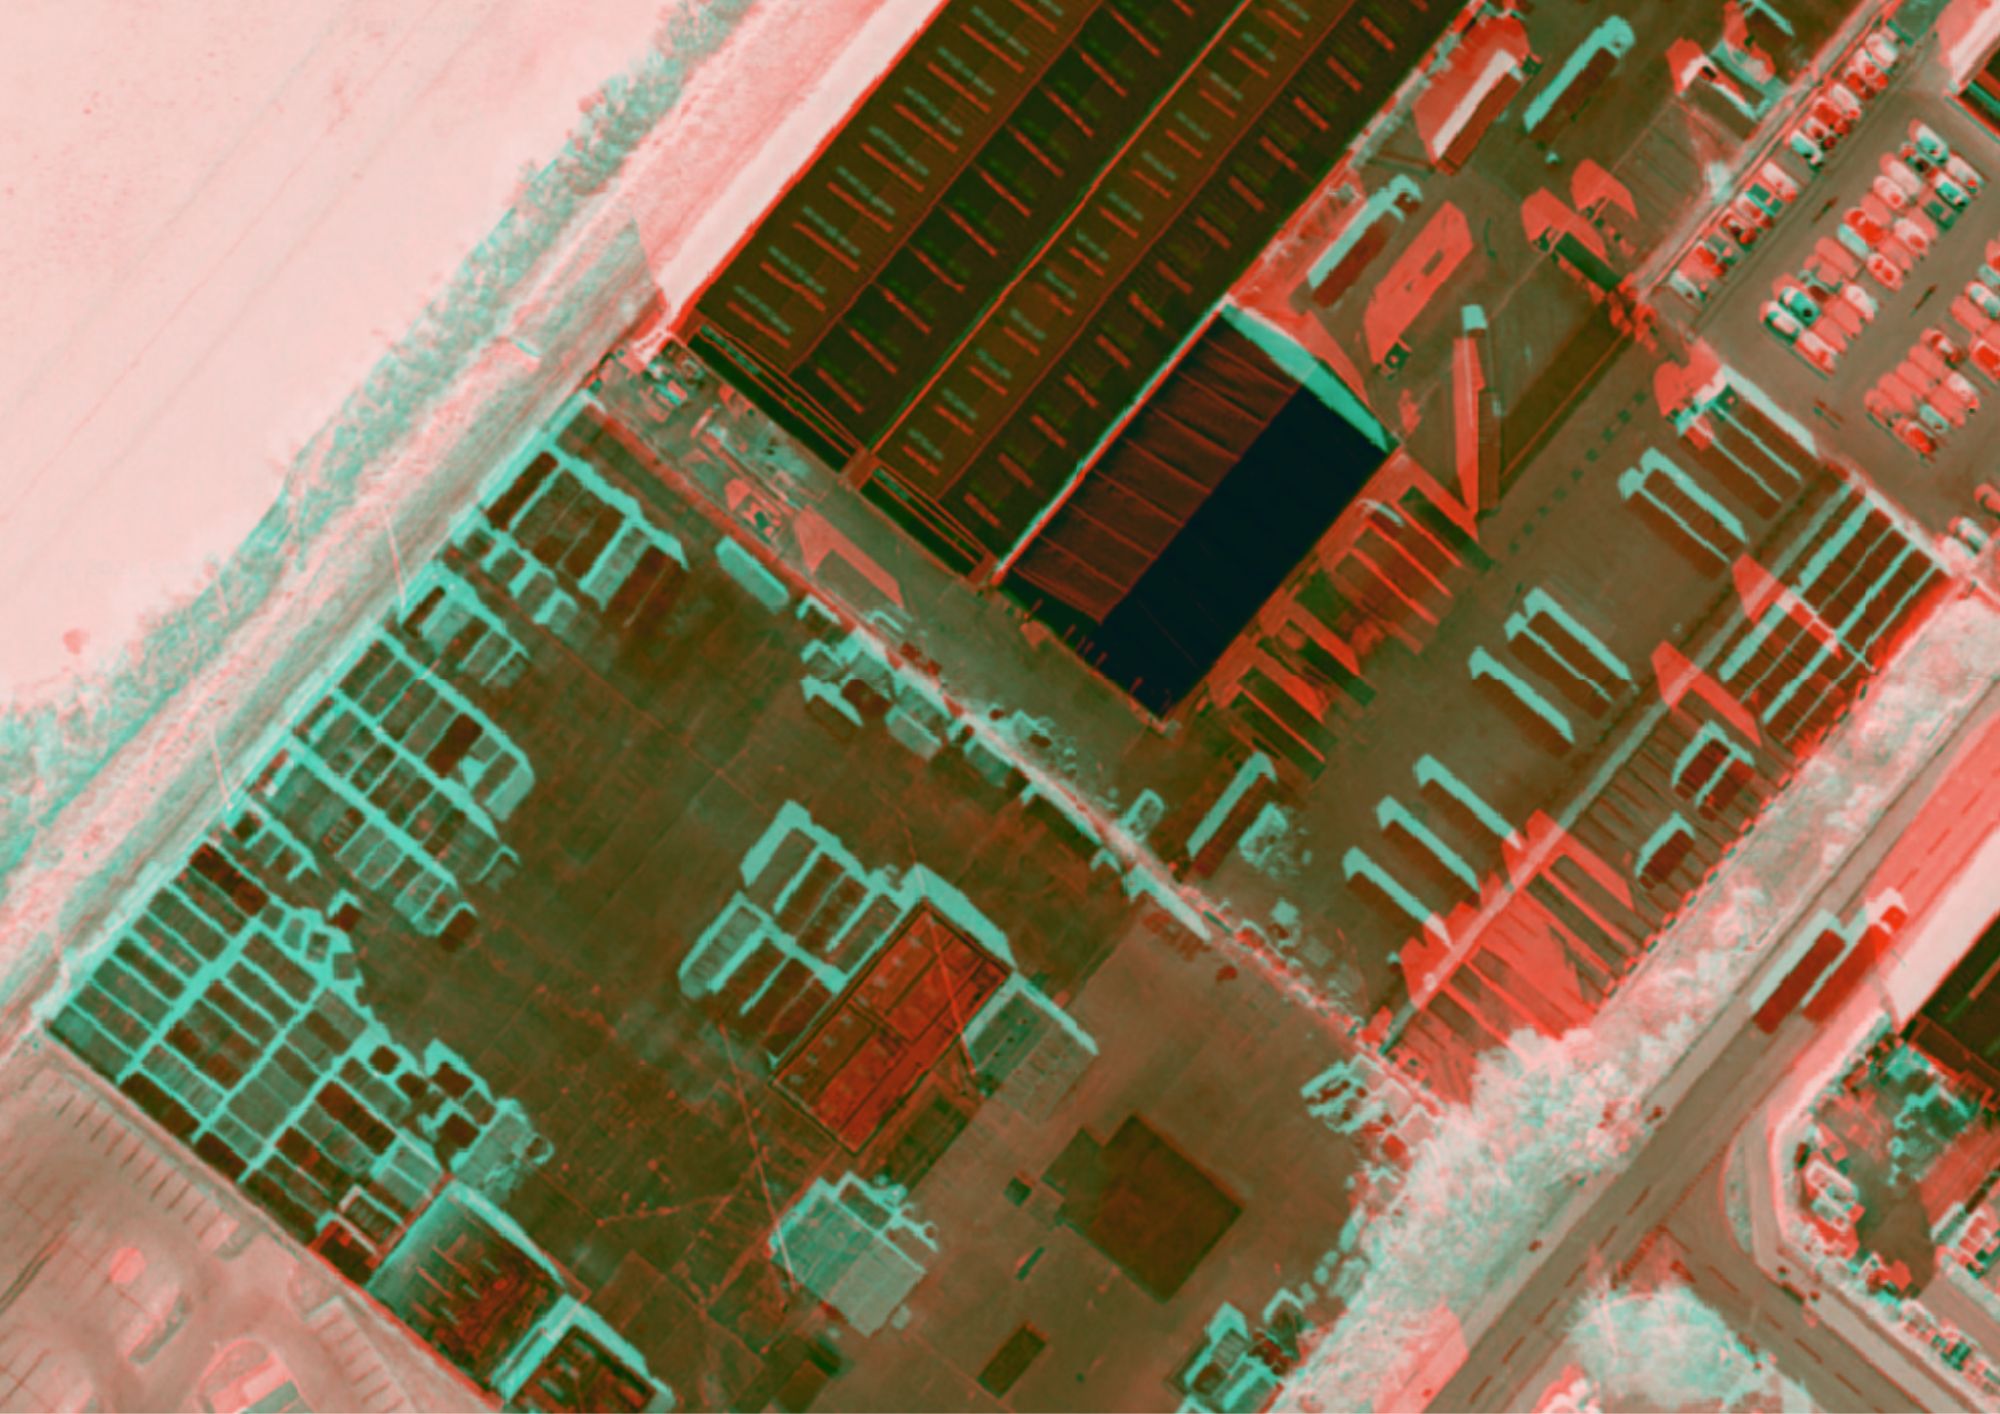
Change Detection
Want to know what changed at a site between two points in time?
Crime Analysis
Local crime patterns mapped against your site, so you can see exactly what your area faces.
Martyn's Law
We see your site or event the way a threat actor would. We highlight what you're vulnerable to and provide visual reports that support mitigations and justify security funding.
“We think like a threat actor, so you don’t have to.”
The sectors we know best.
Our five step process.
Scoped in days. Delivered in weeks. Supported for the life of the site.
Call with an analyst
Understand the asset, the people, the concerns.
Intelligence gathering
Drone capture, OSINT, GEOINT, sector data.
Visual analysis
Models, viewsheds, coverage maps, threat scoring.
Report & debrief
Decision-ready deliverable, walked through in person.
Aftercare
Policies age, sites change. We stay in the loop.
How we deliver your report.
Every engagement ends with a clear picture of your site you can act on. How that picture lands depends on your team.
Digital
The visual report as a PDF, the 3D model in a secure online viewer, and working files on request. Everything shareable across your team in minutes.
Physical
Hardbound report, mounted plans and tagged printouts for the site office. Built for the people who need the picture on the wall, not on a screen.
In-person
A named analyst presents the findings on site. Walkthroughs of the key sightlines, stewarding positions and mitigation priorities, with the team who will use them.
Virtual
The same briefing over a secure video call, or an asynchronous walkthrough of the 3D model and overlays. For the teams who aren't in the room.
Why we do what we do.
The official picture across the UK last year, tied to the sectors we work in. Our reports are built for the real picture behind these numbers, on the site that matters to you.
Meaning an attack is highly likely. The current assessment is the baseline for Martyn's Law readiness at stadiums, arenas, theatres, festivals, conferences and VIP functions.
Source · gov.uk, current→Highest annual total on record since 2017. Theft, damage and weather claims across HQs, logistics sites, manufacturing floors and commercial estates.
Source · ABI, 17 Feb 2026→England & Wales, year ending December 2025. The baseline picture behind private residences, campus halls, student venues and institutional estates.
Source · ONS, 23 Apr 2026→England & Wales, year ending December 2025. Publicly accessible venues, local-authority sites and retail concessions are the sites most in the firing line.
Source · ONS, 23 Apr 2026→These numbers are the national picture. We build you the site-specific one.
Every Cazimi engagement turns the headline into ground truth on your asset. Evidenced in pictures, not paperwork.
- Viewshed mapping
- Every sightline checked before the gates open.
- CCTV coverage
- Every camera, every gap, one diagram.
- Drone and 3D site models
- One shared picture for the whole team.
- Lighting and route
- After-dark and movement exposure, closed.
- Mitigation costings
- Ranked by risk cut per pound, not polish.
- Threat score
- One defensible figure, evidenced to the ground.
Get your Cazimi threat score.
Every threat we rate is backed by something we saw on your site. Not guesswork. You get a single score, plus the two that matter most: the most likely threat, and the most dangerous one.
Our threat scores are provided for strategic decision-making and do not constitute guaranteed probability.
Request your score →Book your free 30 minute call.
You’ll speak to an analyst, not a salesperson. We’ll talk through your site, your operations and the reporting style that best fits your situation. Pick a date and time or browse our full service catalogue.